
Adrift
Adrift story begins on September 23, 1983. Tami Oldham (Shailene Woodley) and Richard Sharp (Sam Claflin) leave Tahiti. They believe this will be a side trip on their cruise around the South Pacific and New Zealand.

Adrift, a drama adventure movie about sailing the high seas
A British couple hired them in Papeete to deliver their 44-foot yacht, Hazana, to San Diego while the couple flies home on a family emergency. However, Tami and Richard couldn’t anticipate they would be sailing directly into Raymond, one of the most catastrophic hurricanes in recorded history.
In the movie, Tami awakens in aftermath of the storm to find Richard badly injured and their boat in ruins. With no hope of rescue, Tami must find the strength and determination to save herself and the only man she has ever loved.
Based on a true story
Real life wasn’t as forgiving as the movie. Richard Sharp lost his life, Tami Oldham spent 41 days in survival mode alone on the ocean while suffering severe head injuries. It took her years to cope with the trauma caused by the loss of her fiancé and the violence of the hurricane.
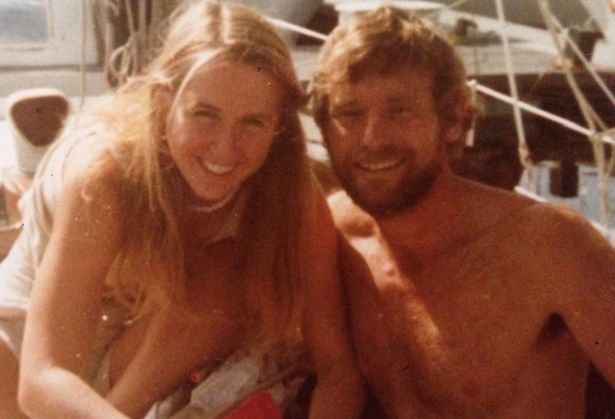
Tami Oldham Ashcraft and Richard Sharp
Oldham eventually wrote the story of her ordeal in a book titled “Red Sky In Mourning: The True Story Of A Woman’s Courage And Survival At Sea” from which Adrift is inspired.
Why did this happen in the first place?
Back in the 1980s, weather forecasting and telecommunications weren’t as advanced as they are today by any means. Sailors used to listen to radio broadcasts on shortwave receivers, a boat makes noise at sea, and there wasn’t a replay button in case part of the weather forecast wasn’t fully heard or understood.

C Crane CCRadio-SW
In 1978, the first hurricane-tracking model based on atmospheric dynamics – the movable fine-mesh (MFM) model – began operating. It was actually not until well in the 1980s that numerical weather prediction gained credibility. It consistently outperformed statistical models only in the 1990s.
The Geophysical Fluid Dynamics Laboratory (GFDL) hurricane model was used for research purposes from 1973. Later in the mid-1980s, it became an operational model. The National Weather Service started using this model in 1995 and kept improving it.
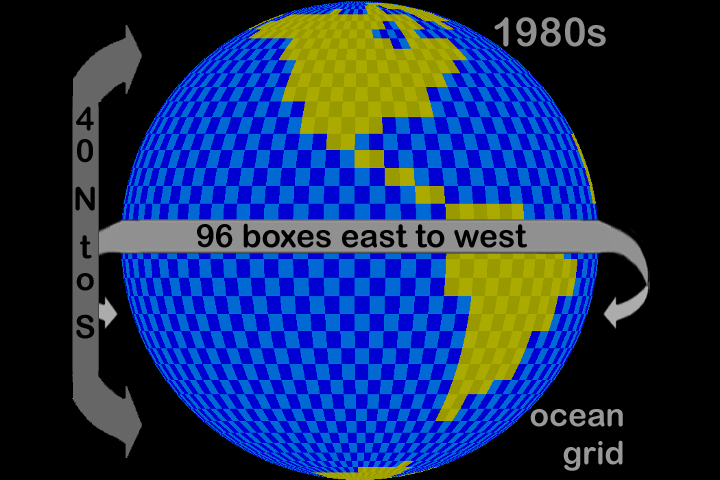
Ocean grid in the 1980s

Ocean grid in 2009
This is more than 10 years after Tami and Richard relied on statistical models received from the weather channel WWV aboard Hazana. While there were some hints, it wasn’t obvious to decipher what was in the making even four days before they got hit by the hurricane. It seems there was a lot of unknown : “Richard later scribbled ‘Cyclonic’? in the logbook” — Tami describes Richard as not appearing overly concerned and they continue their route North East to San Diego.
They started paying close attention to the depression on October 9th. It was then 1300 NM away, moving West at 12 knots towards them, almost twice their boat’s max speed.
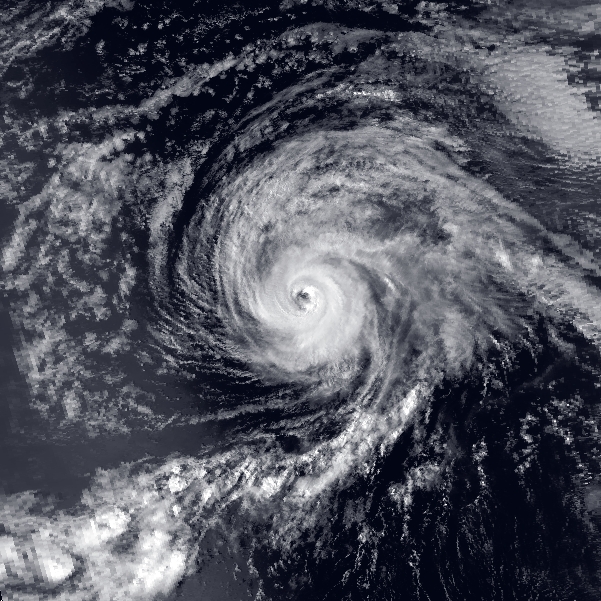
Hurricane Raymond 1983
Within 48 hours, Raymond’s trajectory changed and it was heading further to the Northwest. Tami and Richard simply could not escape it at that point.
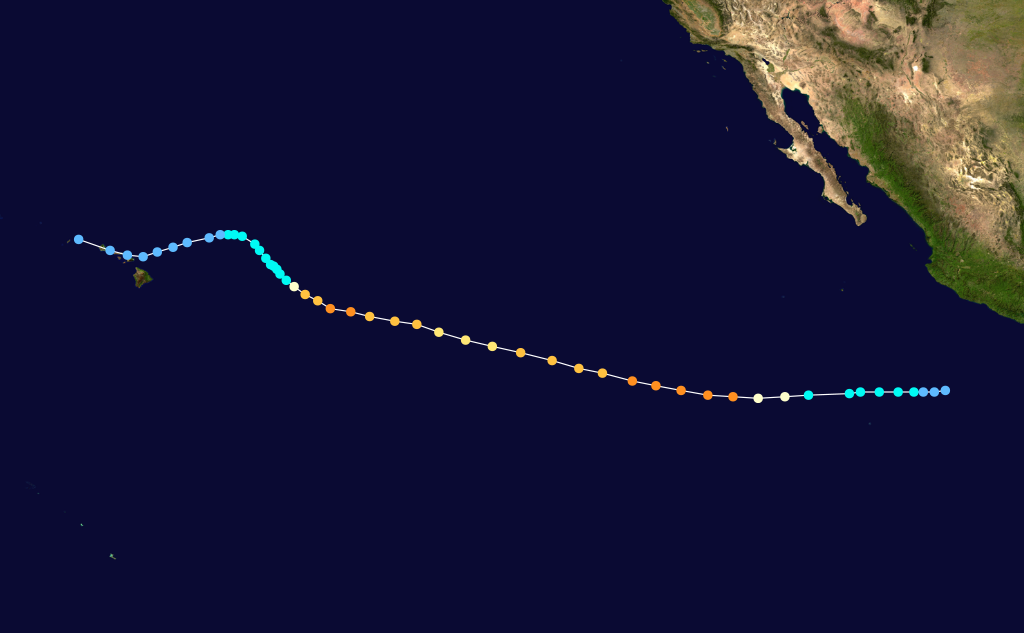
Hurricane Raymond track 1983
Unfortunately the book doesn’t explain the rationale to make the decision to head North instead of South to get closer to the safer Equatorial zone. Would have they been short on food, water and fuel in that case?
What has changed since 1983?
Three fundamental things have dramatically improved safety at sea
- Weather models have become way more sophisticated and hence forecasts are more accurate.
- GRIB files and satellites make weather models accessible anywhere at anytime
- One no longer needs to decipher an audio message coming from a shortwave radio. Rich animated graphic representations of wind, waves and currents have made weather forecasts incredibly precise and intuitive. Furthermore, the data can be crunched to produce simulations and suggest optimal routes.
![]()
What remains the same?
- The need to analyze forecast data to anticipate the worst possible conditions. Departure date and time must depend on weather conditions to be on the safe side.
- The need to do it at least once a day and to adjust the route if necessary.
- While routing calculation estimates x numbers of days at sea, add 15-20% to that value and make it your benchmark for food, water and fuel supplies.
- Avoid sailing in tropical regions during hurricane season. My last major sailing trip was to deliver a 42 footer catamaran from Cuba to France. I got the offer on a Saturday and landed in Havana just three days later. It was late June and hurricane season was around the corner. It was consequently much safer to go as early as possible with a crew of two rather than spending time recruiting a crew of four which would have delayed our departure and potentially exposed us to extreme weather.
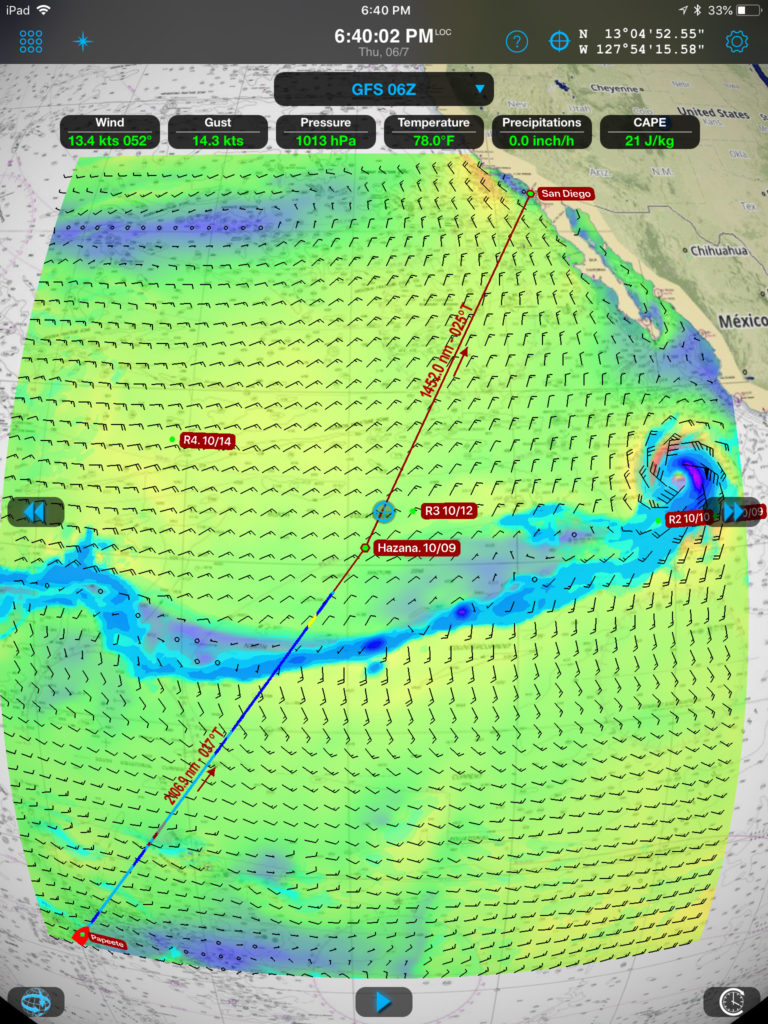
Hazana versus Raymond locations in 1983 layered with 06/07/2018 GFS model
![]()
Sources:
https://www.imdb.com/title/tt6306064/
https://en.wikipedia.org/wiki/1983_Pacific_hurricane_season#Hurricane_Raymond
http://articles.chicagotribune.com/2003-03-19/features/0303180492_1_sailing-cabin-south-pacific
https://www.gfdl.noaa.gov/climate-modeling

